A Gamebook Report with Graphviz, Google Sheets, Python, and Juypter/Colab
An 11 year old in our house needed to do a book report for school in the form of a board game and selected a gamebook, apparently the generic name for the trademarked Choose Your Own Adventure books. The non-linear narrative made the choice of board layout easy -- just use the graph of pages-transitions ("Turn to page 110").
The graphviz library is always my first choice when I want to visualize nodes and edges, and the python graphviz module provides a convenient way to get data into a renderable graph structure.
I wanted to work with the 11 year old as much as possible, so I picked a programming environment that can be used anywhere, jupyter notebooks, and we ran it in Google's free hosted version called colab.
The data entry was going to be the most time consuming part of the project, and something we wanted to be able to work on both together and apart. For that I picked a Google sheet. It gave us the right mix of ease of entry, remote collaboration, and a familiar interface. Python can read from Google sheets directly using the gspread module, saving a transcription/import step.
It took us a few weeks of evenings to enter the book's info into the data spreadsheet. The two types of data we needed were places, essentially nodes, and decisions, which are edges. For every place we recorded starting page, a description of what happens, and the page where you next make a decision or reach an ending. For every decision we recorded the page where you were deciding, a description of the choice, and the page to which you'd go next. As you can see in the data spreadsheet that was 139 places/nodes and 177 decisions/edges.
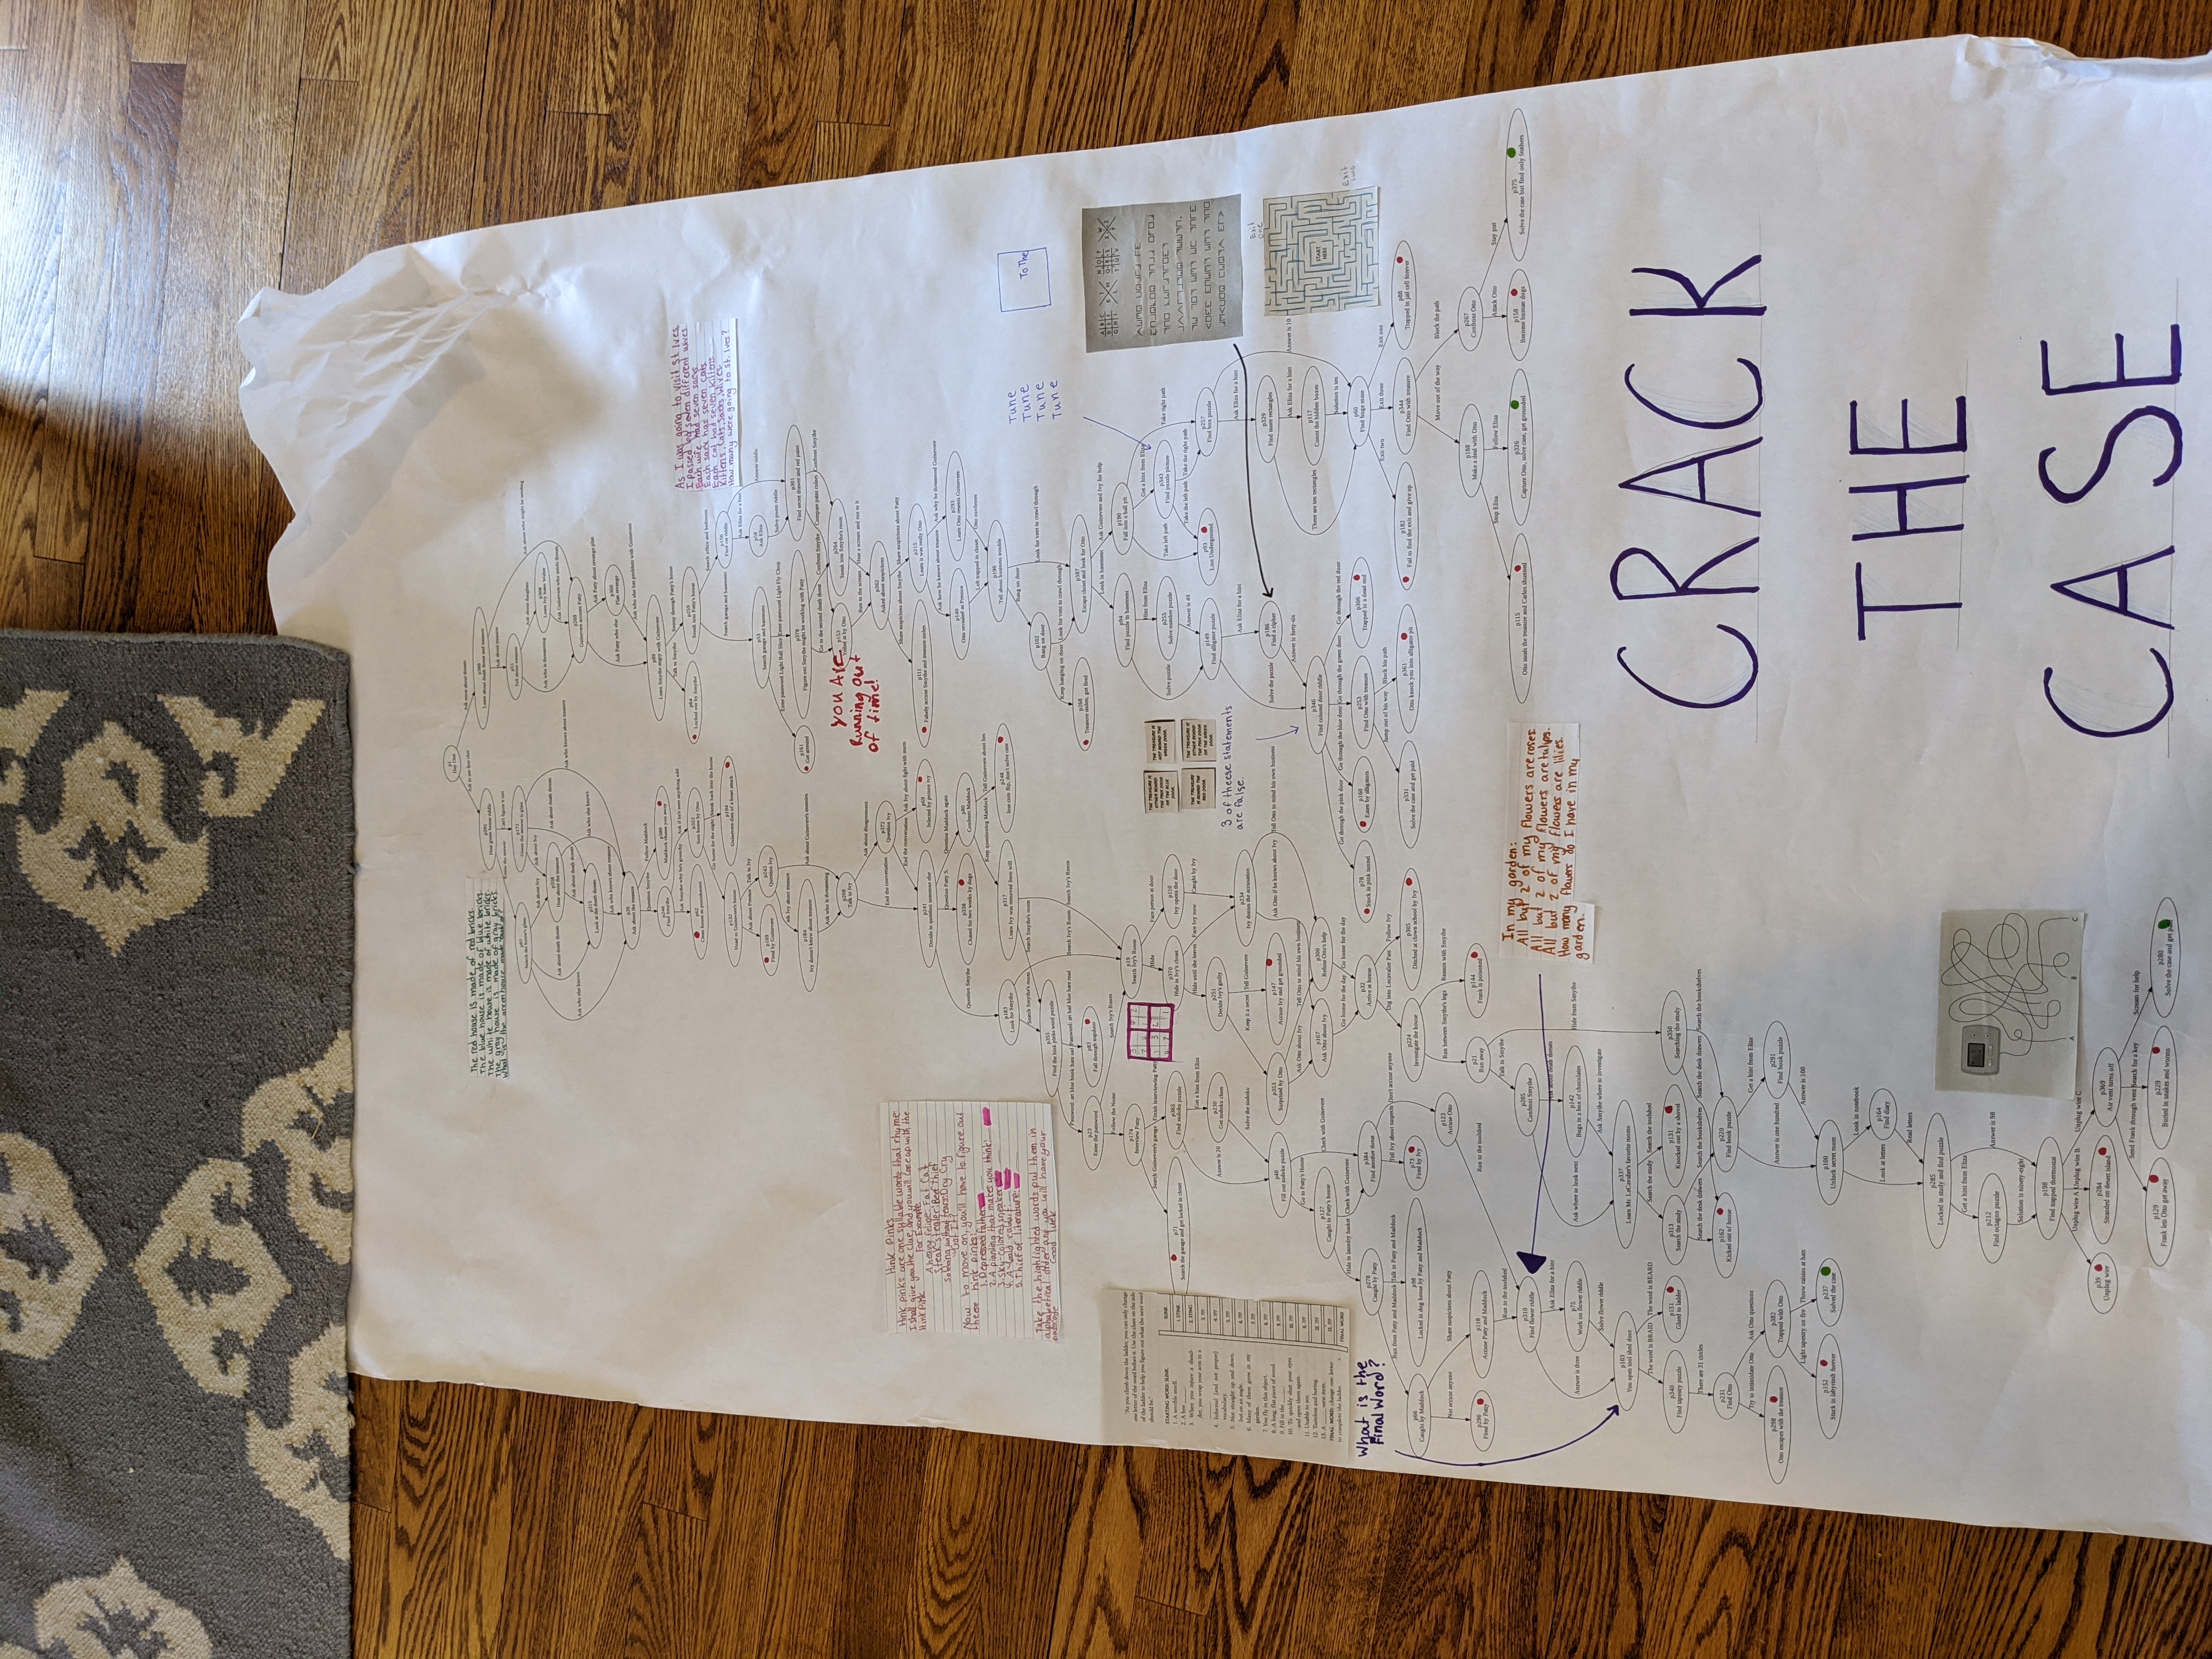
Once we'd entered all the data we were able to run a short python program to load the data from the spreadsheet, transform it into a graph object, and then render that graph as a pdf file. That we printed with a large format printer, and then the 11 year old layered on art, puzzles, rules, and everything else that turns a digraph into a playable game. The final game board is shown below, with a zoomed section in the album.
One interesting thing about this particular book that was only evident once the full graph was in front of us was that the very first choice in the book splits you into one of two trees that never reconnect. Lots of later choices in the book loop back and cross over, but that first choice splits you into one of two separate books.
I've omitted the title and author info from the book to stop this giant spoiler from showing up on google searches, but the 11 year old assures me it was a good, fun read and recommends it.