Tag: python (Atom feed)
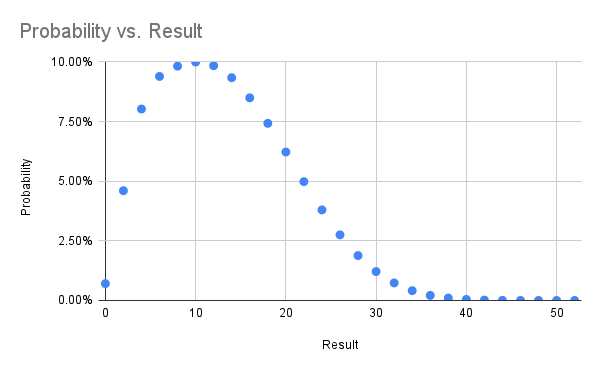
Outcome Probability for One Handed Solitaire
Back in 1994 my circle of high school friends spent a lot of time sitting around talking (there were no cell phones) and for about a week we were all playing one handed solitaire. In suburban St. Louis we called it idiot's delight solitaire (which turns out to be an entirely different game), because there is absolutely no human input after the shuffle. As soon as you've started playing it's already determined whether you've won -- you just spend five minutes learning if you did.
Naturally we wondered how likely our very rare wins were, and being a computer nerd back then too I wrote a Pascal(!) program to simulate the game and arrived at the conclusion you win one in every 142 games.
Now thirty years later I've taught the game to the eleven year old in our home, who is just game back from a phone-free summer camp with a deck of cards and dubious shuffling skills.
My old Pascal is lost to bitrot, but the game as python, using a sort of janky off the shelf deck_of_cards module is trivial:
def play():
    deck = deck_of_cards.DeckOfCards()
    hand = []

    while not deck._deck_empty():
        hand.append(deck.give_random_card())

        while len(hand) > 3:
            if hand[-1].suit == hand[-4].suit:
                del hand[-3:-1]
            elif hand[-1].rank == hand[-4].rank:
                del hand[-4:]
            else:
                break
    return len(hand)
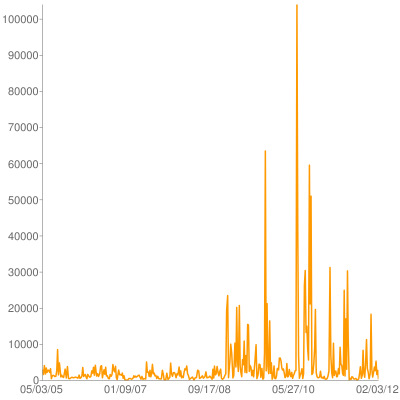
On the 486 I was running at the time I recall getting ten thousand or so runs over many days. On a tiny Linode in the modern era I got 50 million runs in 15ish hours.
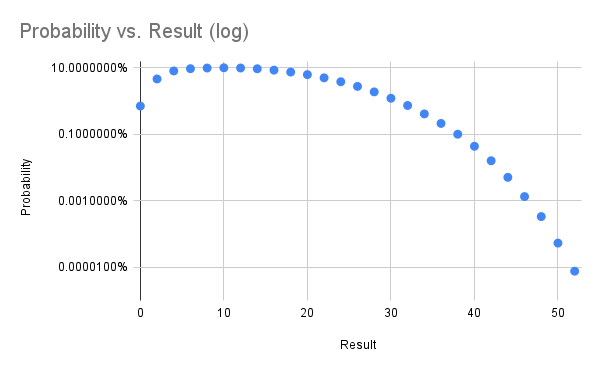
I've gathered the results in a spreadsheet and included some probability graphs below. In trying to find the real name of this game I came across a previous analysis from 2014 which comes to the same overall probability. That blog post is now down (hence the archive.org links) with ominous messages telling folks the author is definitely no longer thinking about this game.
A Gamebook Report with Graphviz, Google Sheets, Python, and Juypter/Colab
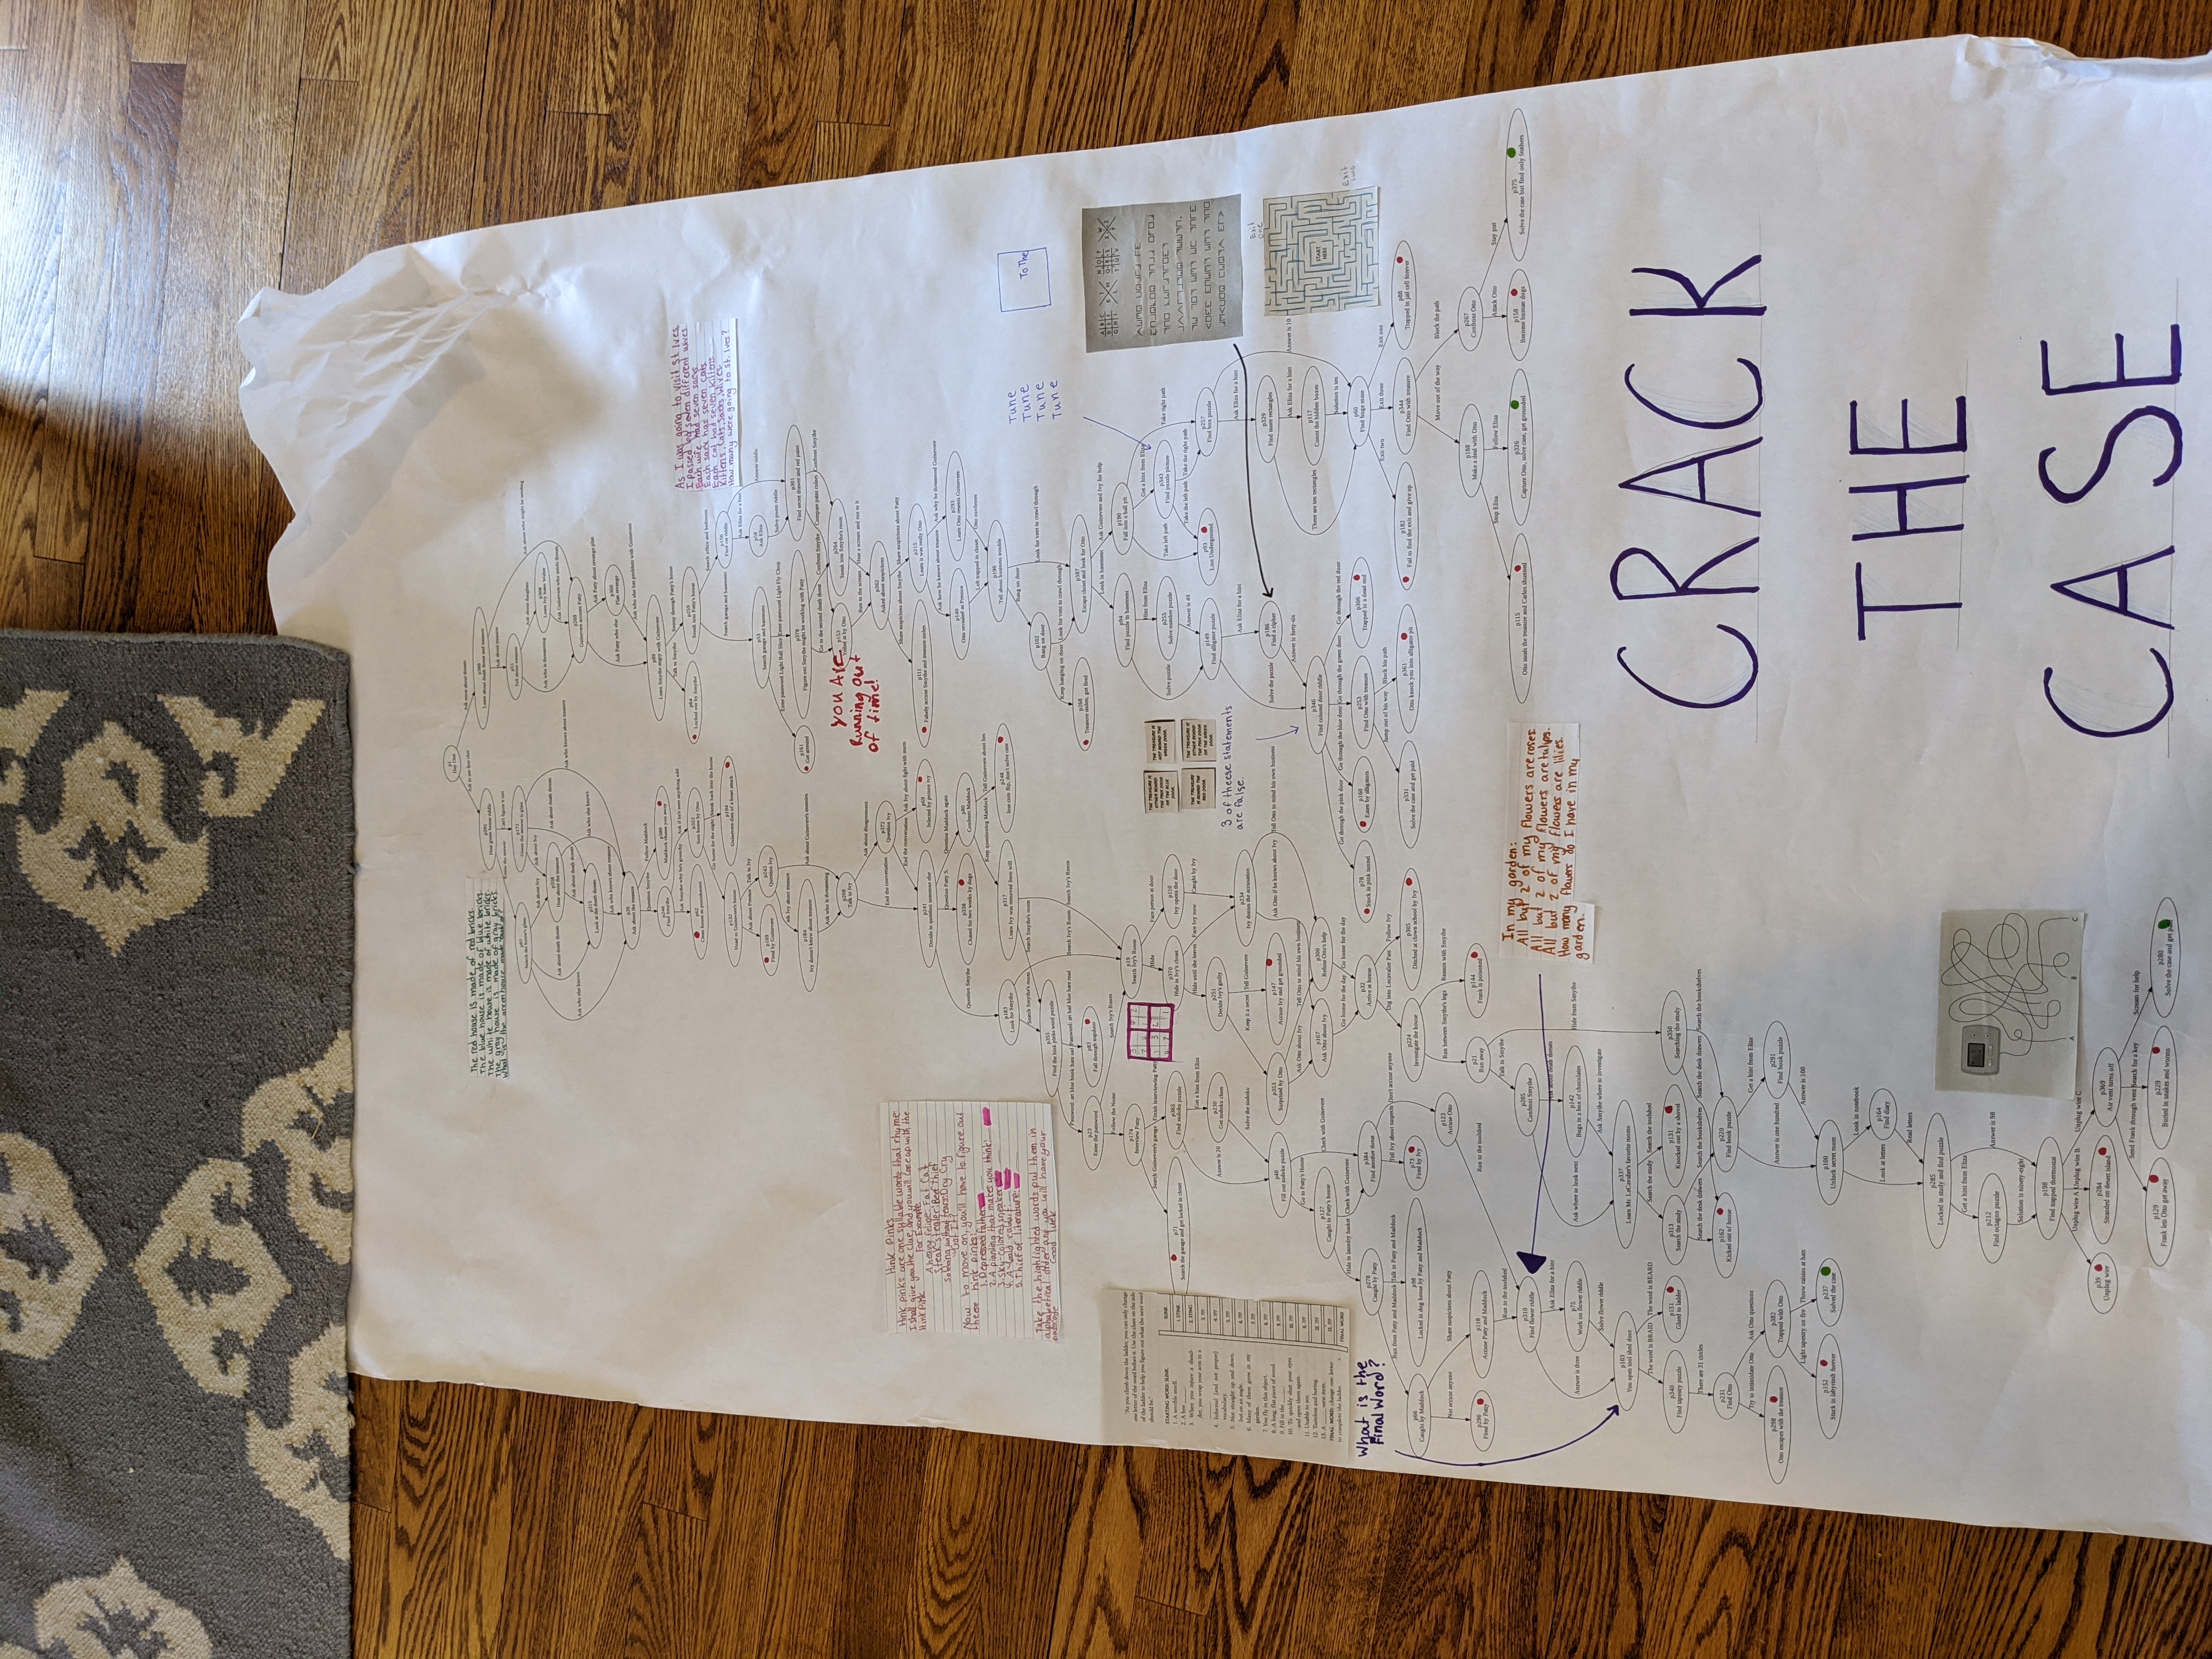
An 11 year old in our house needed to do a book report for school in the form of a board game and selected a gamebook, apparently the generic name for the trademarked Choose Your Own Adventure books. The non-linear narrative made the choice of board layout easy -- just use the graph of pages-transitions ("Turn to page 110").
The graphviz library is always my first choice when I want to visualize nodes and edges, and the python graphviz module provides a convenient way to get data into a renderable graph structure.
I wanted to work with the 11 year old as much as possible, so I picked a programming environment that can be used anywhere, jupyter notebooks, and we ran it in Google's free hosted version called colab.
The data entry was going to be the most time consuming part of the project, and something we wanted to be able to work on both together and apart. For that I picked a Google sheet. It gave us the right mix of ease of entry, remote collaboration, and a familiar interface. Python can read from Google sheets directly using the gspread module, saving a transcription/import step.
It took us a few weeks of evenings to enter the book's info into the data spreadsheet. The two types of data we needed were places, essentially nodes, and decisions, which are edges. For every place we recorded starting page, a description of what happens, and the page where you next make a decision or reach an ending. For every decision we recorded the page where you were deciding, a description of the choice, and the page to which you'd go next. As you can see in the data spreadsheet that was 139 places/nodes and 177 decisions/edges.
Once we'd entered all the data we were able to run a short python program to load the data from the spreadsheet, transform it into a graph object, and then render that graph as a pdf file. That we printed with a large format printer, and then the 11 year old layered on art, puzzles, rules, and everything else that turns a digraph into a playable game. The final game board is shown below, with a zoomed section in the album.
One interesting thing about this particular book that was only evident once the full graph was in front of us was that the very first choice in the book splits you into one of two trees that never reconnect. Lots of later choices in the book loop back and cross over, but that first choice splits you into one of two separate books.
I've omitted the title and author info from the book to stop this giant spoiler from showing up on google searches, but the 11 year old assures me it was a good, fun read and recommends it.
Home Alarm Analytics With AWS Kinesis
Home security system projects are fun because everything about them screams "1980s legacy hardware design". Nowhere else in the modern tech landscape does one program by typing in a three digit memory address and then entering byte values on a numeric keypad. There's no enter-key -- you fill the memory address. There's no display -- just eight LEDs that will show you a byte at a time, and you hope it's the address you think it is. Arduinos and the like are great for hobby fun, but these are real working systems whose core configuration you enter byte by byte.
The feature set reveals 30 years of crazy product requirements. You can just picture the well-meaning sales person who sold a non-existent feature to a huge potential customer, resulting in the boolean setting that lives at address 017 bit 4 and whose description in the manual is:
ON: The double hit feature will be enabled. Two violations of the same zone within the Cross Zone Timer will be considered a valid Police Code or Cross Zone Event. The system will report the event and log it to the event buffer. OFF: Two alarms from the same zone is not a valid Police Code or Cross Zone Event
I've built out alarm systems for three different homes now, and while occasionally frustrating it's always a satisfying project. This most recent time I wanted an event log larger than the 512 events I can view a byte at a time. The central dispatch service I use will sell me back my event log in a horrid web interface, but I wanted something programmatically accessible and ideally including constant status.
The hardware side of the solution came in the form of the Alarm Decoder from Nu Tech. It translates alarm panel keypad bus events into events on an RS-232 serial bus. That I'm feeding into a Raspberry Pi. From there the alarmdecoder package on PyPI lets me get at decoded events as Python objects. But, I wanted those in a real datastore.
Pylint To Github
I spent a few hours trying to get the Jenkins Git & Github plugins to:
- run pylint on all remote branch heads that:
- arent' too old
- haven't already had pylint run on them
- send the repo status back to GitHub
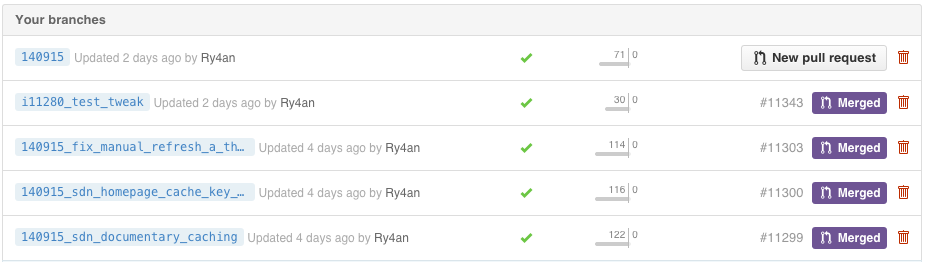
I'm sure it's possible, but the Jenkins Git plugin doesn't like a single build to operate on multiple revisions. The repo statuses weren't posting, the wrong branches were getting built, and it was easier to write a quick script.
Now whenever someone pushes code at DramaFever pylint does its thing, and their most recent commit gets a green checkmark or a red cross. If/when they open a PR the status is already ready on the PR and warns folks not to merge it if pylint is going to fail the build. They can keep heaping on commits until the PR goes green.
I run it from Jenkins triggerd by a GitHub push hook, but it's setup so that even running it from cron on the minute is safe for those without a CI server yet.
Mercurial Chart Extension
Back in 2008 I wote an extension for Mercurial to render activity charts like this one:
Yesterday I finally got around to updating it for modern Mercurial builds, including 2.1. It's posted on bitbucket and has a page on the Mercurial wiki. It uses pygooglechart as a wrapper around the excellent Google image chart API.
I really like the google image charts becuse the entire image is encapsulated as a URL, which means they work great with command line tools. A script can output a URL, my terminal can make it a link, and I can bring it up in a browser window w/o ever really using a GUI tool at all.
If I take any next step on this hg-chart-extension it will be to accept revsets for complex secifications of what changesets one wants graphed, but given that it took me two years to fix breakage that happened with version 1.4 that seems unlikely.
Asynchronous Python Logging
The Python logging module has some nice built-in LogHandlers that do network IO, but I couldn't square with having HTTP POSTs and SMTP sends in web response threads. I didn't find an asynchronous logging wrapper, so I wrote a decorator of sorts using the really nifty monkey patching availble in python:
def patchAsyncEmit(handler):
    base_emit = handler.emit
    queue = Queue.Queue()
    def loop():
        while True:
            record = queue.get(True) # blocks
            try :
                base_emit(record)
            except: # not much you can do when your logger is broken
                print sys.exc_info(
    thread = threading.Thread(target=loop)
    thread.daemon = True
    thread.start(
    def asyncEmit(record):
        queue.put(record)
    handler.emit = asyncEmit
    return handler
In a more traditional OO language I'd do that with extension or a dynamic proxy, and in Scala I'd do it as a trait, but this saved me having to write delegates for all the other methods in LogHandler.
Did I miss this in the standard logging stuff, does everyone roll their own, or is everyone else okay doing remote logging in a web thread?
Syntax Highlighting and Formulas for Blohg
I'm thus far thrilled with blohg as a blogging platform. I've got a large post I'm finishing up now with quite a few snippets of source code in two different programming languages. I was hoping to use the excellent SyntaxHighlighter javascript library to prettify those snippets, and was surprised to find that docutils reStructuredText doesn't yet do that (though some other implementations do).
Fortunately, adding new rendering directives to reStructuredText is incredibly easy. I was able to add support for a .. code mode with just this little bit of Python:
Tags
- funny
- java
- people
- python
- mongodb
- scala
- perl
- meta
- mercurial
- home
- security
- ideas-built
- ideas-unbuilt
- software
Contact
Content License

This work is licensed under a
Creative Commons Attribution-NonCommercial 3.0 Generic License.