Mercurial Chart Extension
Back in 2008 I wote an extension for Mercurial to render activity charts like this one:
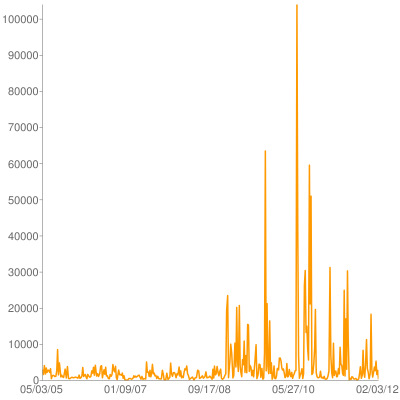
Yesterday I finally got around to updating it for modern Mercurial builds, including 2.1. It's posted on bitbucket and has a page on the Mercurial wiki. It uses pygooglechart as a wrapper around the excellent Google image chart API.
I really like the google image charts becuse the entire image is encapsulated as a URL, which means they work great with command line tools. A script can output a URL, my terminal can make it a link, and I can bring it up in a browser window w/o ever really using a GUI tool at all.
If I take any next step on this hg-chart-extension it will be to accept revsets for complex secifications of what changesets one wants graphed, but given that it took me two years to fix breakage that happened with version 1.4 that seems unlikely.
Tags
- funny
- java
- people
- python
- mongodb
- scala
- perl
- meta
- mercurial
- home
- security
- ideas-built
- ideas-unbuilt
- software
Contact
Content License

This work is licensed under a
Creative Commons Attribution-NonCommercial 3.0 Generic License.