Creating Burn Down Charts for GitHub Repositories Using Google Apps Script
At DramaFever I got folks to buy into to burn down charts as the daily display for our weekly sprints with the rotating release person being responsible for updating a Google spreadsheet with each day's end-of-day open and closed issue counts.
It works fine, and it's only a small time burden, but if one forgets there's no good way to get the previous day's counts. Naturally I looked to automation, and GitHub has an excellent API. My usual take on something like this would be to have cron trigger a script that:
- polls the GitHub API
- extracts the counts
- writes them to some data store
- builds today's chart from the historical data in the datastore
That could be easily done in bash, Python, or Perl, but it's the sort of thing that's inevitably brittle. It's too ad hoc to run on a prod server, so it'll run from a dev shell box, which will be down, or disk full, or rebuilt w/o cron migration or any of the million other ailments that befall non-prod servers.
Looking for something different I tried Google Apps Script for the first time, and it came out very well.
Google Apps Script (GAS) is the JavaScript-based scripting layer for the Google Apps tools. It started out as something entirely internal to Google Spreadsheets (sort of like VBA was for Excel) but has evolved into a first class document type in the Google Apps universe -- on Google Docs/Drive you'll find "Script" in the "Create" menu just a few down from "Document".
It took me a few hours to pick my way through the myriad API endpoints exposed by GAS, but once I did the resulting script was quite short. Hit that link for the full thing, but here's an example:
function updateBugCounts() {
  var resp = UrlFetchApp.fetch("https://api.github.com/repos/DramaFever/www/milestones?access_token=XXX");
  var jsonStr = resp.getContentText();
  var milestones = Utilities.jsonParse(jsonStr);

  var dataSs = SpreadsheetApp.openById("YYY");
  var sheet = dataSs.getSheetByName('Raw Data');
  for (var i = 0; i < milestones.length; i++) {
    milestone = milestones[i];
    sheet.appendRow([milestone.title, Utilities.formatDate(new Date(), "US/Eastern", "yyyy-MM-dd"), milestone.open_issues, milestone.closed_issues])
  }
}
That's all it takes to poll GitHub and add a row to a spreadsheet for each milestone with the current date and the counts for same. The access_token comes from the GitHub OAuth dance (easily done w/ curl) and the openById is the key parameter in the spreadsheet's URL. Running that once by hand can be done from the GAS IDE, but to run it daily you need to add a Trigger ("Resources" -> "Current App's Triggers") on a dialog like this one:

With the trigger calling that function nightly we've got items one, two, and three from the initial list covered. The next bit surprised me, but if you add a doGet method to your script you can publish it as a web app. Google gives you a (ugly) URL and you can pick the access level, which I set to "anyone at dramafever.com".
That doGet method is pretty amazing in that its execution is entirely divorced from the spreadsheet it happens to access. When the URL is hit it runs as me (or optionally as the viewer) and renders a graph on a "UI" that's a GWT-based HTML abstraction. I'd never worked w/ GWT, so the UI controls (and DataViewDefintions, etc.) took me awhile to figure out, but the docs were good and the resulting code is clear.
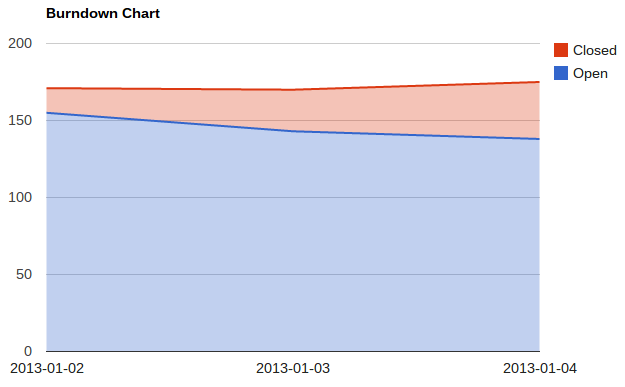
In the end I have a URL that's company-access-only which gives a view like this:


Not the prettiest display in the world, but it loads new data nightly, lets you pick a milestone from those open on GitHub, and updates the chart when you do.
My only annoyance is something I've brought up with GitHub before -- their OAuth scopes are absurdly course-grained. I've got this script and our Jenkins build system with full read-write access to the repository because there's no read-only scope and no issues-only scope.